English Proficiency Test Equivalency Chart
Businesses, colleges, and universities often ask for non-native English speakers to provide an English proficiency test score when applying for school or a job. Use this chart to see how your test score relates to scores of other English proficiency tests.
CISL SF Level | CISL SF Course | CISL SD Level | CISL SD Course | CISL SD Entrance Score | Cambridge English Scale | FCE grade | CAE grade | iBT TOEFL | IELTS band | Duolingo | CEFR |
C1/C2 | Advanced | 10
| Proficient
| 95%-100% | 200-230 | A | 120 120 120 119 | 9 9 8.5 8.5 | 145 150 155 160 | C2 C2 C2+ C2+ | |
9 | Advanced | 90%-94% | 180-199 | A | C B | 97-102 103-107 108-112 113-115 116-118 | 7 7.5 7.5 8 8 | 120 125 130 135 140 | C1 C1 C1 C1+ C1+ | ||
B2 |
Upper Intermediate
| 8 | Low Advanced | 80%-89% | 160-179
| B | 80-85 86-91 92-96 | 6.5 6.5 7 | 105 110 115 | B2+ B2+ B2+ | |
7 | Upper- Intermediate | 70%-79% | C | 62-67 68-73 74-79 | 5.5 6 6 | 90 95 100 | B2 B2 B2 | ||||
B1 | Intermediate | 6 | Intermediate | 60%-69% | 140-159 | 44-49 50-55 56-61 | 5 5 5.5 | 75 80 85 | B1+ B1+ B1+ | ||
5 | 50%-59% | 26-31 32-37 38-43 | 4 4.5 4.5 | 60 65 70 | B1 B1 B1 | ||||||
A2 | Low Intermediate | 4 | Low- Intermediate | 40%-49% | 120-139 | 5-8 9-13 14-19 20-25 | 3 3.5 3.5 4 | 40 45 50 55 | A2+ A2+ A2+ A2+ | ||
3 | 30%-39% | 0 1 2-4 | 2.5 3 3 | 25 30 35 | A2 A2 A2 | ||||||
A1 | Basic | 2 | Basic | 20%-29% | 100-119 | 0 | 2.5 | 20 | A1 | ||
1 | 1%-19% | 80-99 |
| 0 | 2 | 15 | A1 |
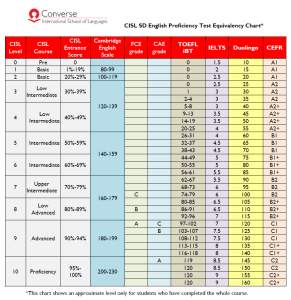
*This chart shows an approximate level only for students who have completed the whole course.
Are you planning on taking an English proficiency test soon? Be sure to check out CISL’s intensive TOEFL Preparation Course, Cambridge Preparation Courses (including CAE, FCE, and PET), and IELTS Preparation Course. CISL’s small class sizes (a maximum of 8 students per class) and our dedicated, well-trained teachers will prepare you for your upcoming exam and teach you how to take your test with confidence!